Flight cancellations on Friday
Hundreds of flights across the United States were canceled starting on Friday, with deeper cuts looming in the coming days.
Federal Aviation Administration and Transportation Department officials have said the traffic reduction is necessary to ease pressure on air traffic controllers, some of whom have been calling in sick and working second jobs because they have not been paid during the longest government shutdown in U.S. history.
The officials identified 40 airports where flights should be cut in phases, with the goal of reducing activity by 10 percent by the end of next week.
The disruptions have rippled to other airports but, at least so far, they have appeared to be relatively limited. Airlines focused the first wave of cancellations on shorter, regional flights, and major airports were working largely as normal on Friday. But widespread concern that the situation could worsen brought home the effects of the government shutdown to many more Americans.
The reduction in traffic comes weeks before the busy holiday travel season begins in the United States. The airports that have already been affected range from large hubs to smaller destinations. They are in blue states and red states, spread across the country.
Here is a look at how cuts at affected airports compare to cancellations at those hubs this time last year:
Share of scheduled flights that were canceled on Friday and throughout Nov. 2024
|
Washington Reagan
|
17.4%
151 of 869 flights |
0.2%
|
|
Louisville
|
8%
12 of 150 |
0.1%
|
|
Cincinnati
|
7.2%
18 of 250 |
0.2%
|
|
Houston Hobby
|
6%
20 of 336 |
0.4%
|
|
Indianapolis
|
5.7%
17 of 297 |
0.2%
|
|
Oakland
|
5.4%
11 of 203 |
0.4%
|
|
Boston
|
4.8%
46 of 960 |
0.1%
|
|
Newark
|
4.5%
42 of 940 |
0.4%
|
|
New York JFK
|
4.5%
41 of 913 |
0%
|
|
New York LaGuardia
|
4.5%
47 of 1,045 |
0.1%
|
|
Minneapolis/St. Paul
|
4.5%
35 of 784 |
0.1%
|
|
Detroit
|
4.3%
35 of 806 |
0.1%
|
|
Philadelphia
|
4.3%
30 of 701 |
0.1%
|
|
San Francisco
|
4.3%
41 of 960 |
1.2%
|
|
Atlanta
|
4.2%
84 of 1,979 |
0.1%
|
|
Los Angeles
|
3.9%
50 of 1,274 |
0.3%
|
|
Denver
|
3.6%
67 of 1,866 |
1.4%
|
|
Ontario
|
3.6%
6 of 168 |
0.7%
|
|
Phoenix
|
3.6%
44 of 1,206 |
0.3%
|
|
Chicago O’Hare
|
3.5%
82 of 2,313 |
0.3%
|
|
San Diego
|
3.5%
22 of 627 |
0.4%
|
|
Dallas-Fort Worth
|
3.4%
62 of 1,810 |
1.7%
|
|
Tampa
|
3.4%
17 of 493 |
0.2%
|
|
Baltimore-Washington
|
3.2%
18 of 562 |
0.2%
|
|
Washington Dulles
|
3.2%
20 of 619 |
0.2%
|
|
Salt Lake City
|
3.2%
21 of 650 |
0.2%
|
|
Charlotte
|
3.1%
41 of 1,327 |
0.1%
|
|
George Bush Houston
|
3.1%
35 of 1,112 |
0.2%
|
|
Memphis
|
3.1%
5 of 160 |
0.2%
|
|
Fort Lauderdale
|
2.8%
16 of 564 |
0.1%
|
|
Dallas Love Field
|
2.7%
11 of 402 |
0.9%
|
|
Orlando
|
2.7%
27 of 1,001 |
0.2%
|
|
Miami
|
2.7%
23 of 839 |
0.1%
|
|
Honolulu
|
2.5%
10 of 400 |
0.3%
|
|
Las Vegas Reid
|
2.5%
29 of 1,138 |
0.3%
|
|
Chicago Midway
|
2.5%
10 of 405 |
0.3%
|
|
Portland (Ore.)
|
2.3%
10 of 438 |
0.5%
|
|
Seattle-Tacoma
|
2.3%
24 of 1,033 |
0.5%
|
|
Anchorage
|
1%
2 of 201 |
1.3%
|
|
Teterboro
|
0%
0 of 8 |
No data
|
Related Posts
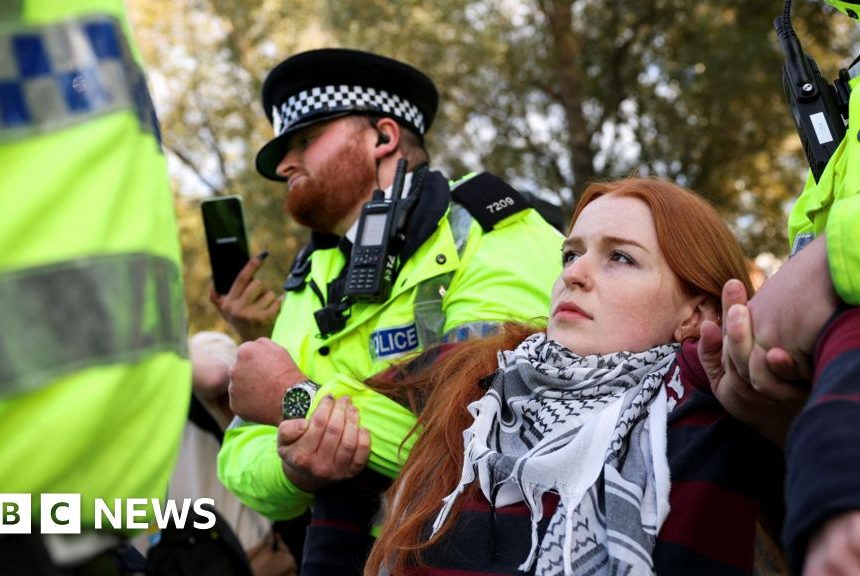
Arrests at protest supporting Palestine Action near Labour conference
Police have made a number of arrests at a protest…
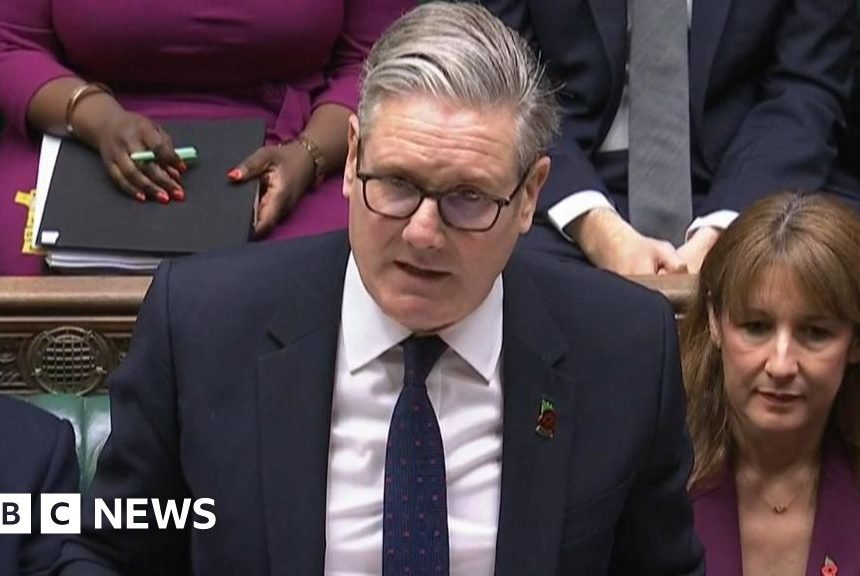
Keir Starmer declines to rule out breaking manifesto tax pledges
Paul Seddon,Political reporter and Chris Mason,Political editorWatch: Keir Starmer's two…
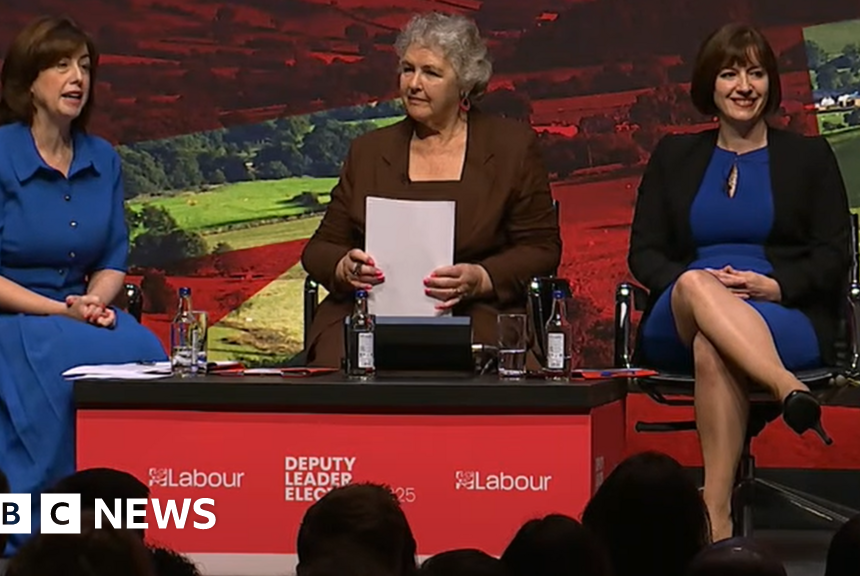
Labour deputy debate exposes differences in approach
Rival deputy leadership candidates Bridget Phillipson and Lucy Powell went…